
What If the Market Was Already Waiting for Tomorrow?
By Dr. Efrat Levy
Most traders begin their day the same way.
They open a chart. They search for support. They draw resistance. They wait for indicators to catch up.
Then they react.
But what if the most important locations in tomorrow's market had already been identified... before the opening bell ever rang?
A Strange Thought
Imagine that after Wall Street closes for the day, something quietly begins working.
Not another trading algorithm chasing price. Not another AI trying to predict tomorrow's candles.
Something completely different.
An engine that ignores today's market noise and instead analyzes years of historical market behavior, searching for the price locations that have repeatedly mattered the most.
Hours later, before the next trading session even begins, it finishes its work.
No forecasts. No probabilities flashing on a screen.
Just a map. A collection of fixed price levels.
Nothing moves anymore. Nothing recalculates. Nothing repaints. They simply wait.
These predefined locations are called Trigger Points.
A Map for Every Market
Now imagine this process isn't performed only for the Nasdaq. It happens independently for:
- Nasdaq
- S&P 500
- Dow Jones
- Russell 2000
- Gold
- Silver
- Crude Oil
- Bitcoin
- Major currency pairs
Every market receives its own unique map.
At first glance, these maps appear completely unrelated. After all, 23,410 on Nasdaq has absolutely nothing to do with 6,215 on the S&P.
Or does it?
The Hidden Connection Nobody Sees
Here's where things become interesting.
Although every market trades at completely different prices, some Trigger Points actually represent the exact same structural location across different markets.
Different numbers. Different charts. Different instruments.
Yet mathematically, they describe the same underlying event.
We call these Equivalent Trigger Points.
You never see them by looking at a single chart, because they only reveal themselves when multiple markets are viewed together.
Then Something Unexpected Happens
Calculating Trigger Points is only the first half of the story. The second half unfolds in real time.
Throughout the trading session, another engine watches every correlated market simultaneously. But it isn't asking "Has the Nasdaq reached resistance?"
Instead, it asks a far more intriguing question:
"Have all correlated markets reached their own Equivalent Trigger Points... at nearly the same moment?"
When the answer is yes, something remarkable happens. Three, sometimes four, completely independent markets suddenly tell the exact same story.
Each market has reached its own predefined Trigger Point. Each confirms the others. No single chart is making the decision anymore, the entire correlated ecosystem is.
That synchronized event is called a Correlated Trigger Point. Or simply... CTP.
Example #1, Four Markets, One Decision
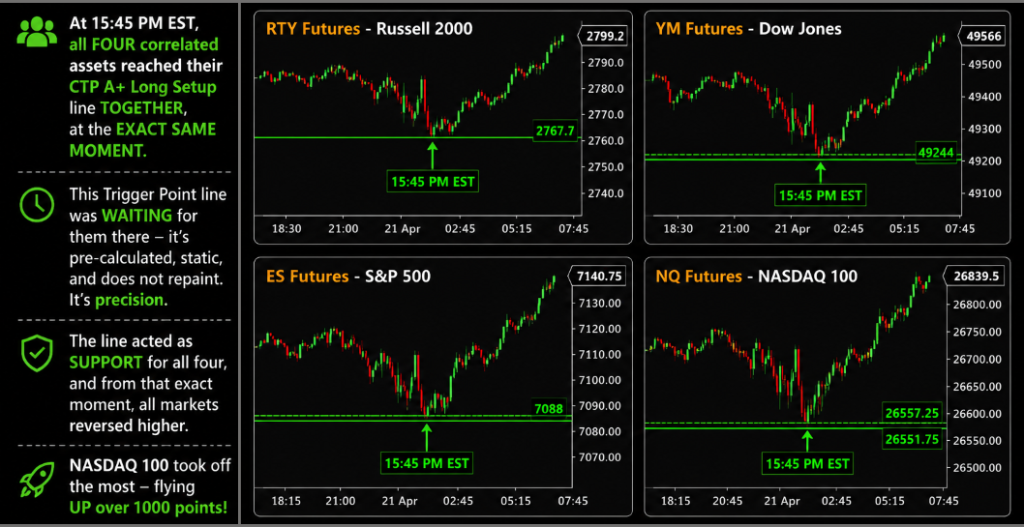
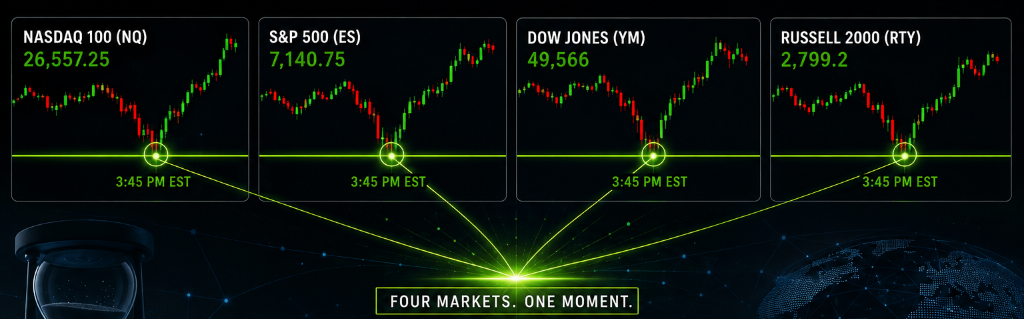
Look at the first example. At exactly 3:45 PM EST, something extraordinary happened.
The Nasdaq 100, S&P 500, Dow Jones, and Russell 2000 all arrived at their own independently calculated Trigger Points.
Different prices. Different charts. Yet the exact same structural location.
Those levels had been calculated before the trading session even began. They weren't adjusted afterward. They weren't drawn because price bounced. They were already waiting.
The result? All four markets treated those levels as support. And from that precise moment, the Nasdaq launched into a powerful rally of more than 1,000 points.
Was one chart predicting another? No. Each market independently reached its own destination.
The synchronization itself became the signal.
Example #2, Three Markets, One Rejection
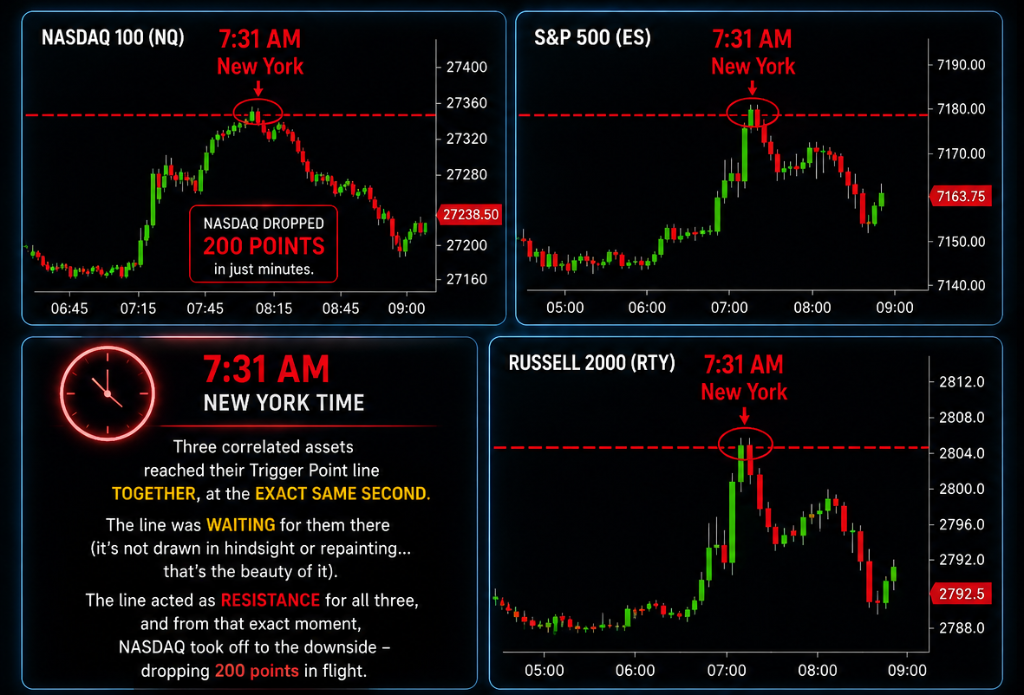
Now consider the second example. This time, at 7:31 AM New York time, three correlated markets reached their Trigger Points simultaneously.
- Nasdaq Futures
- S&P 500 Futures
- Russell 2000 Futures
Again, three different prices. Three different charts. Three independently calculated Trigger Points. But one shared structural event.
This time those predefined levels acted as resistance. Within minutes, the Nasdaq reversed sharply, falling nearly 200 points.
Nothing was redrawn. Nothing repainted. The Trigger Points had been there long before price arrived.
Why Correlation Matters
Financial markets rarely move in isolation. Index futures constantly influence one another. Gold and silver often behave as a pair. Energy markets move together. Currencies interact continuously.
It's remarkably similar to the principle of communicating vessels, separate containers, different shapes, different sizes, yet connected beneath the surface. Raise the water level in one, and the others respond.
Financial markets often behave in much the same way.
CTP doesn't attempt to predict where price must go. Instead, it patiently waits until multiple independent markets confirm that the same structural event is happening simultaneously.
A Different Way to Look at Markets
CTP isn't just another indicator. It isn't another oscillator. It isn't another collection of support and resistance lines.
It's a two-layer framework.
The first layer maps every market before the session begins. The second watches those markets throughout the day, waiting for synchronized confirmation across correlated assets.
One layer answers: "Where could something meaningful happen?"
The second answers: "Has that moment actually arrived?"
When both answers align, that's when a Correlated Trigger Point is born.
And perhaps that's the most fascinating part of all, because sometimes the market isn't waiting for your indicators to react.
Sometimes, it's simply waiting to arrive at a place that was already there.