
CTP Academy
Correlated Trigger Points
CTP Academy
Correlated Trigger Points
One Day in the Nasdaq: How to Read the Story the Market Is Telling
A short article for CTP graduates
11 annotated charts from 25 September
Build-up. Breakout. Retest. Arrival together. Exhaustion.
One Day in the Nasdaq: How to Read the Story the Market Is Telling
Dr. Efrat Levy, Quantitative Trader and Founder
A short article for CTP graduates, with 11 annotated charts from 25 September.
On Thursday, 25 September, the Nasdaq did something it does almost every day: it told a story. It chopped, it broke out, it came back to test, it climbed, it stalled, it flipped, it fell, it stalled again, and it returned. Whoever saw that as a sequence of candles saw noise. Whoever saw it as a sequence of events saw the direction before it happened. This article teaches you to see the second thing.
The Lines
On the chart there are red and green lines. These are not lines I drew by hand. They are Trigger Points: static support and resistance levels, calculated by a unique algorithm before the day begins. The whole method is called Correlated Trigger Points, because the truly interesting things happen when the Nasdaq reaches its line together with its brothers, ES, YM and RTY, arriving at their own lines at the very same moment. More on that below.
Phase One: The Market Builds Energy
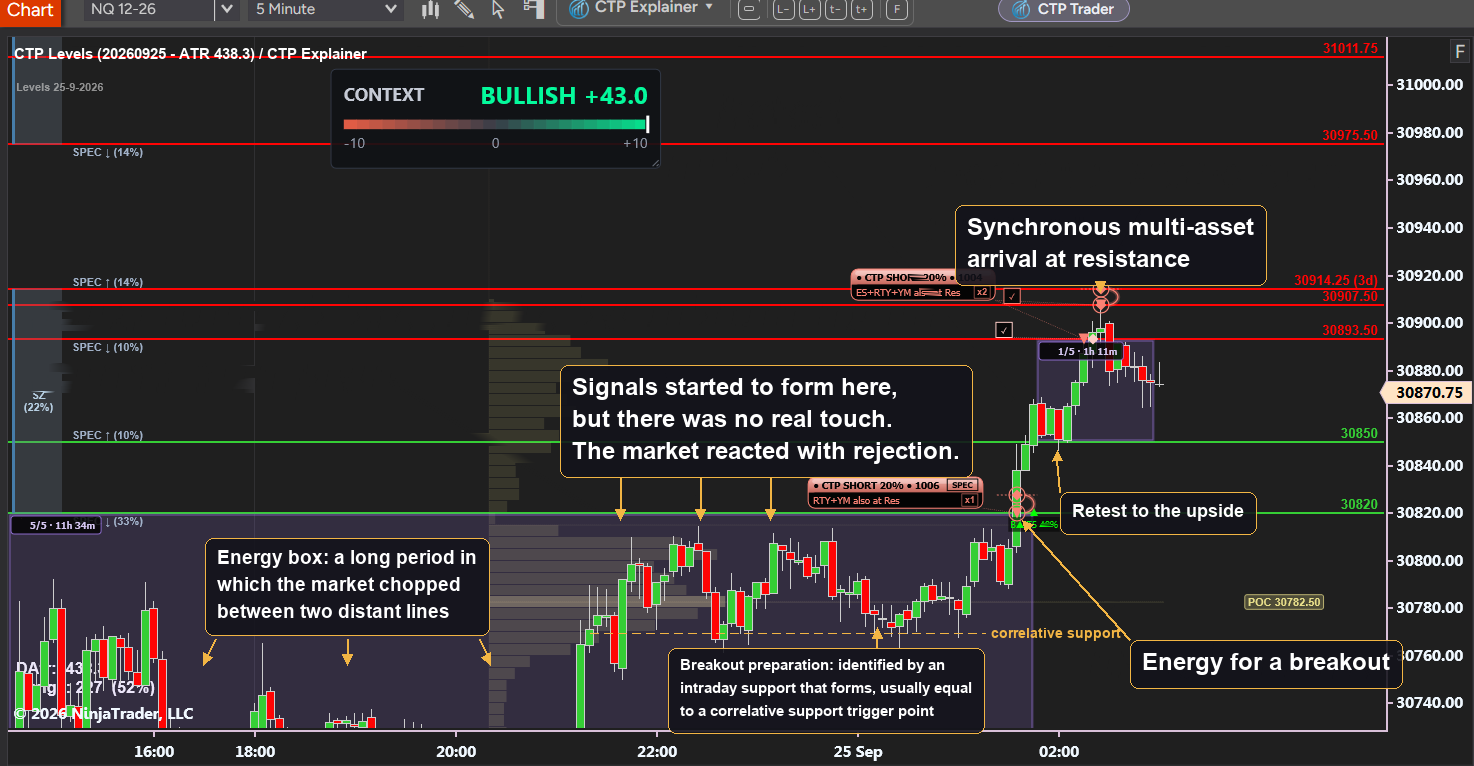
From four in the afternoon until one thirty at night the Nasdaq did nothing. It moved between two distant lines, 30782 and 30820, for hours on end. Three times it approached the upper line, and three times it was rejected without ever really touching it. That looks boring, but it is the most important thing of the day. The market is not "doing nothing". It is building energy. The longer it stays between two distant lines, the more fuel it has for the move that comes next. And the three rejections tell us there is a seller at 30820, and the market is not ready to cross it yet. Meanwhile, under the radar, support was forming: the lows around 30775 never broke. That is the preparation for a breakout, and whoever spots it knows where to wait.
Phase Two: The Breakout and the Retest
At 1:45 the fuel ignited. The Nasdaq broke 30820 in a sharp move and closed above it. From here the direction is up, and that is what we call a positive bias. And now the thing most traders miss. After a breakout, the market almost always comes back to test. At 2:12 it pulled back, touched 30850 with a wick, and was pushed back up. That is the retest, and a retest has an advantage: the line that was an obstacle has become a springboard, and the market respects it.
Phase Three: Everyone Arrives Together
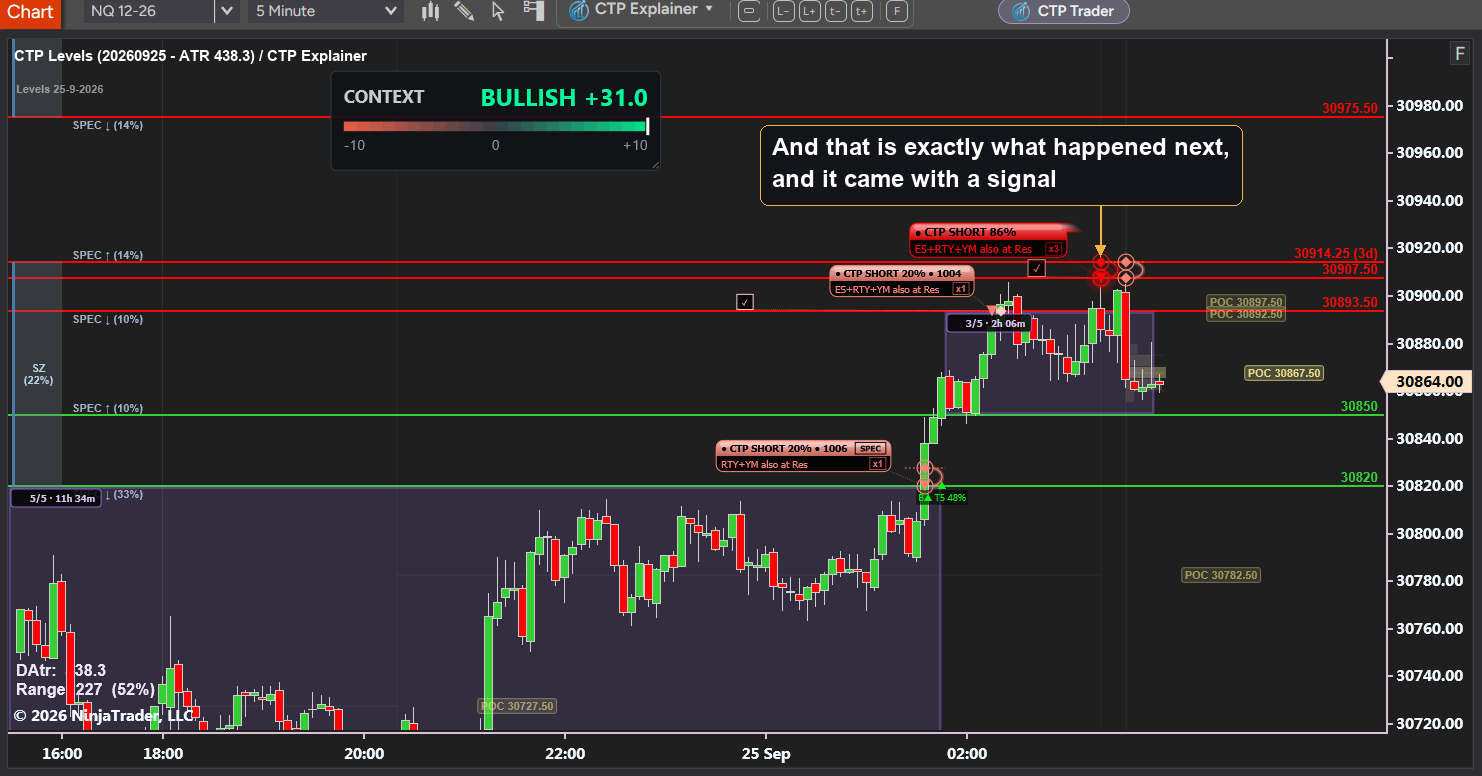
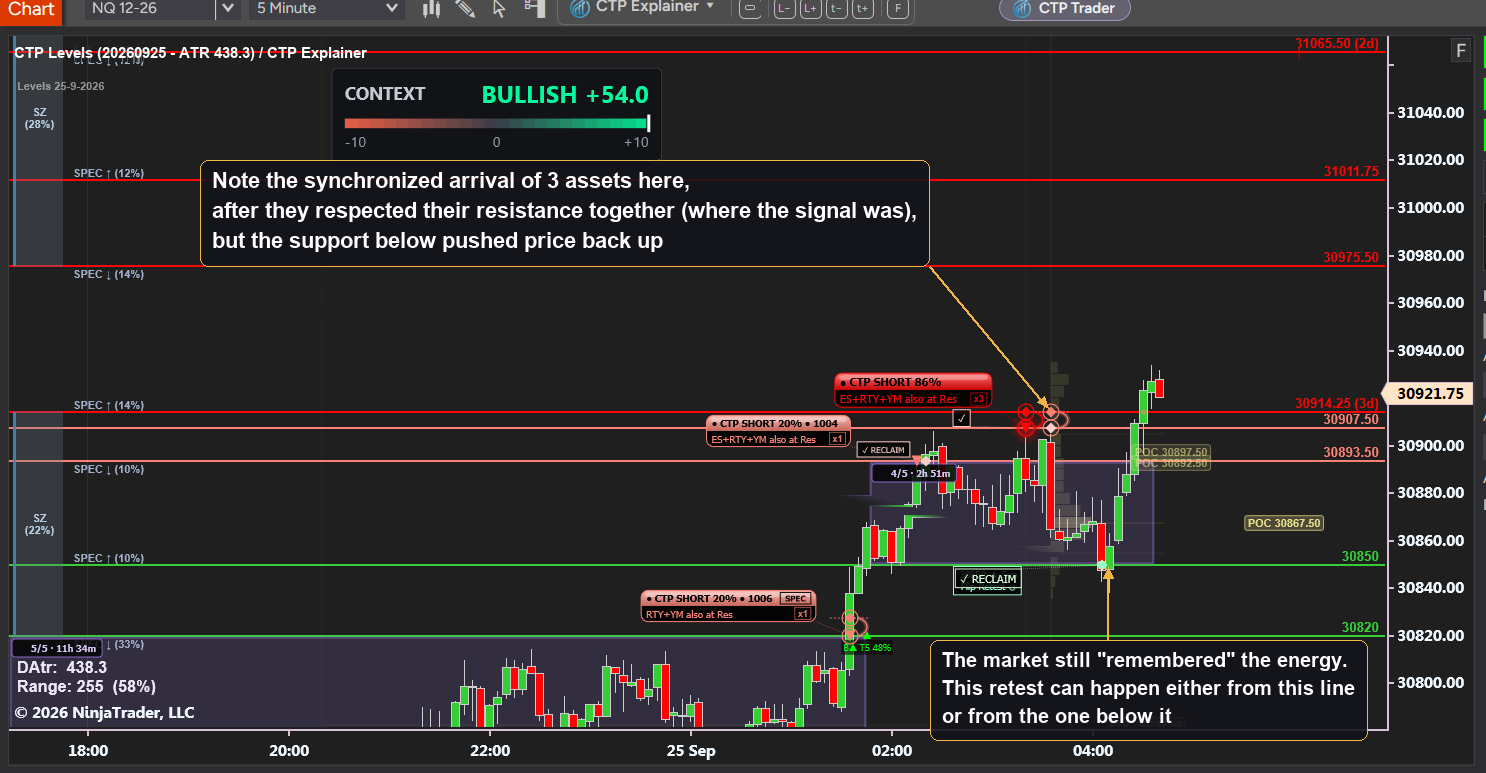
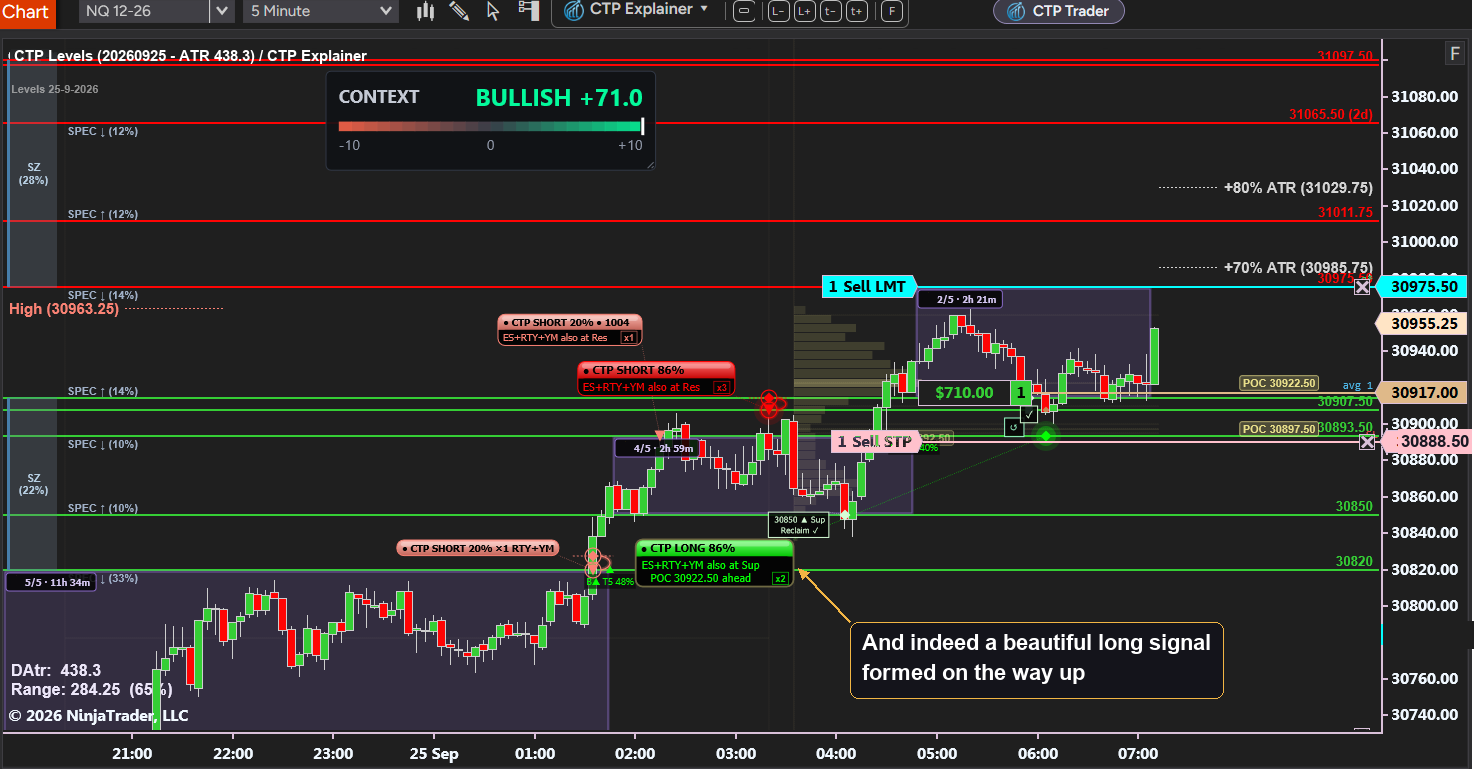
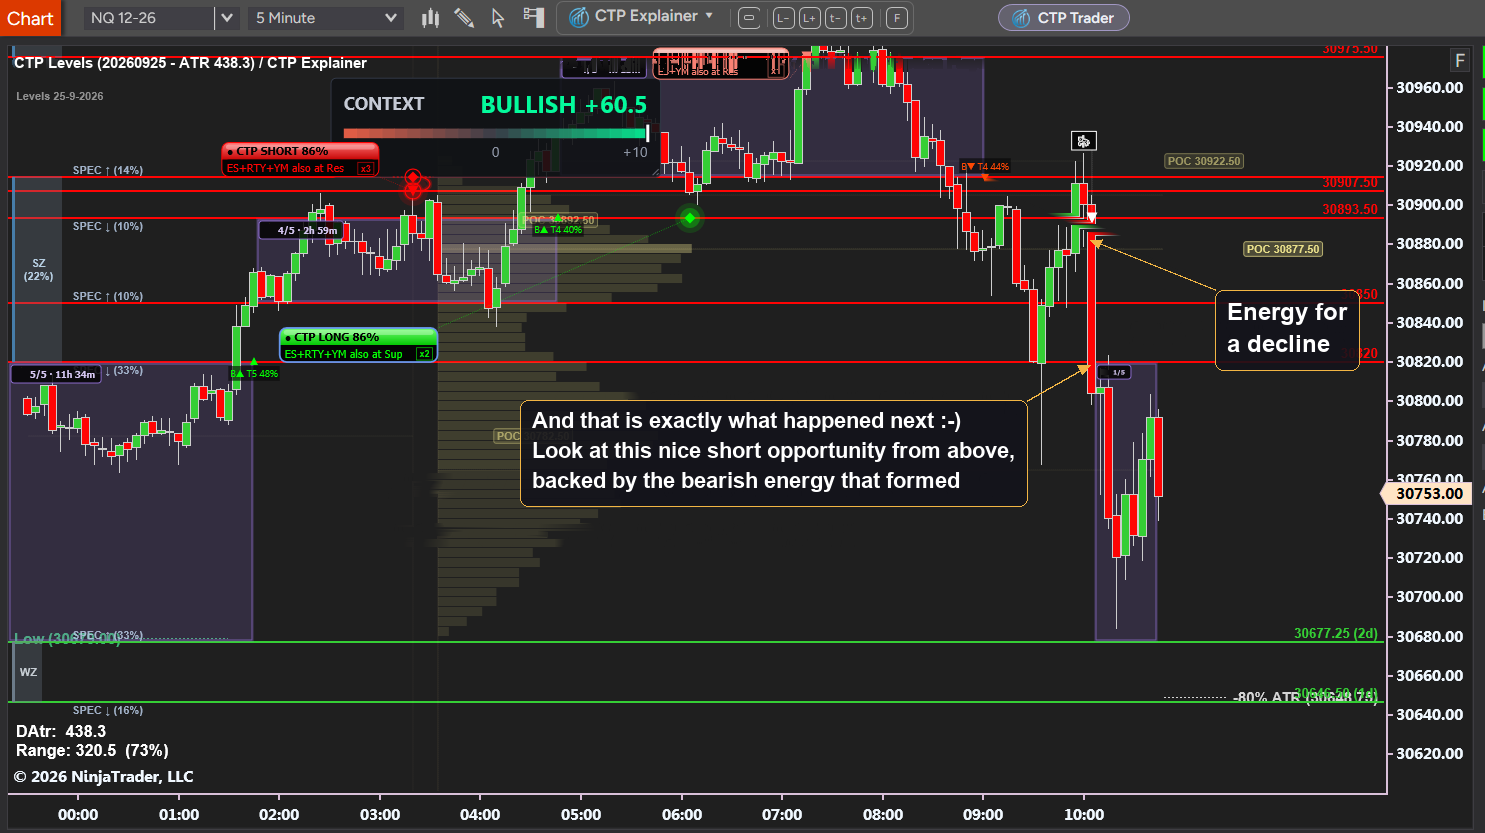
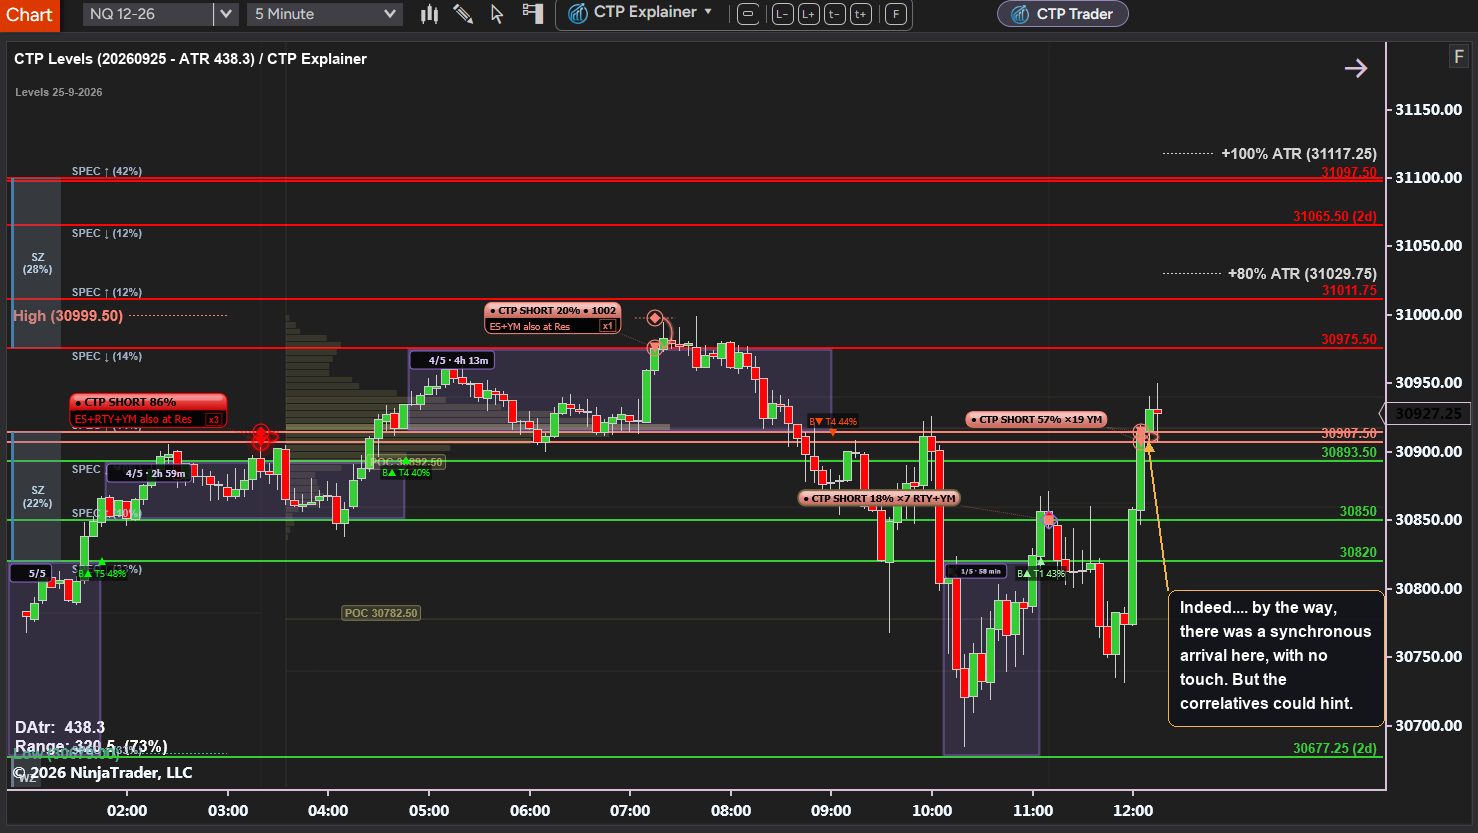
At 2:15 the Nasdaq reached 30907. On its own that would not say much. But at that exact moment ES, RTY and YM reached their own resistances. The signal jumped from twenty percent to eighty-six percent. That is a synchronous arrival, and it is the heart of the method: one asset at resistance is noise, four assets together at their resistances is a signal. And indeed, the market was rejected. But look at what happened next: the decline was short, and the support below pushed the price back up. At four in the morning the Nasdaq returned to 30850, touched it, and rose. The market remembered its energy. And from there came the move of the day: a long signal at eighty-six percent, with all three brothers at their supports, an entry at 30893, and a climb to 30975.
Phase Four: Knowing When It Is Over
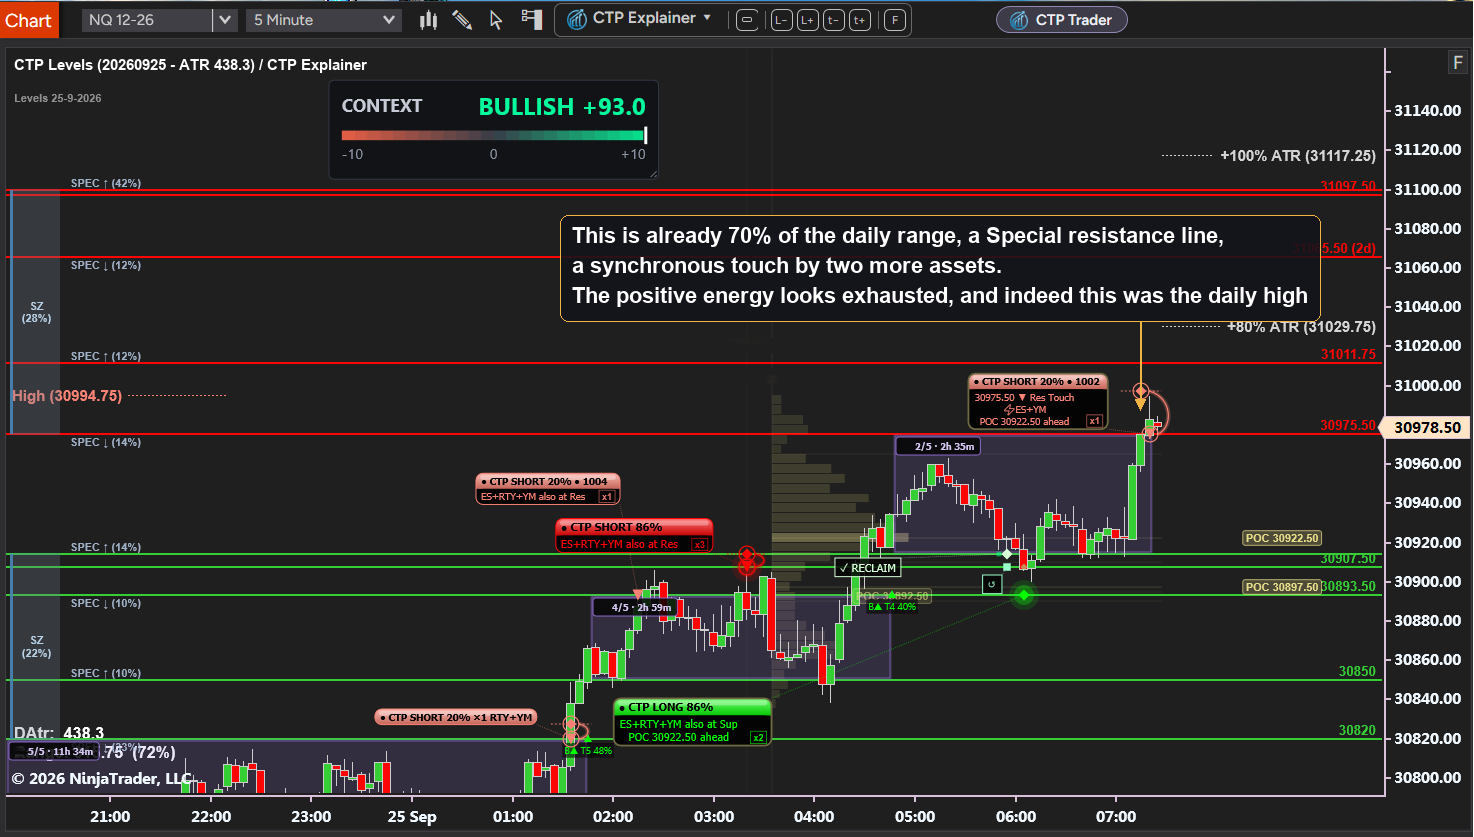
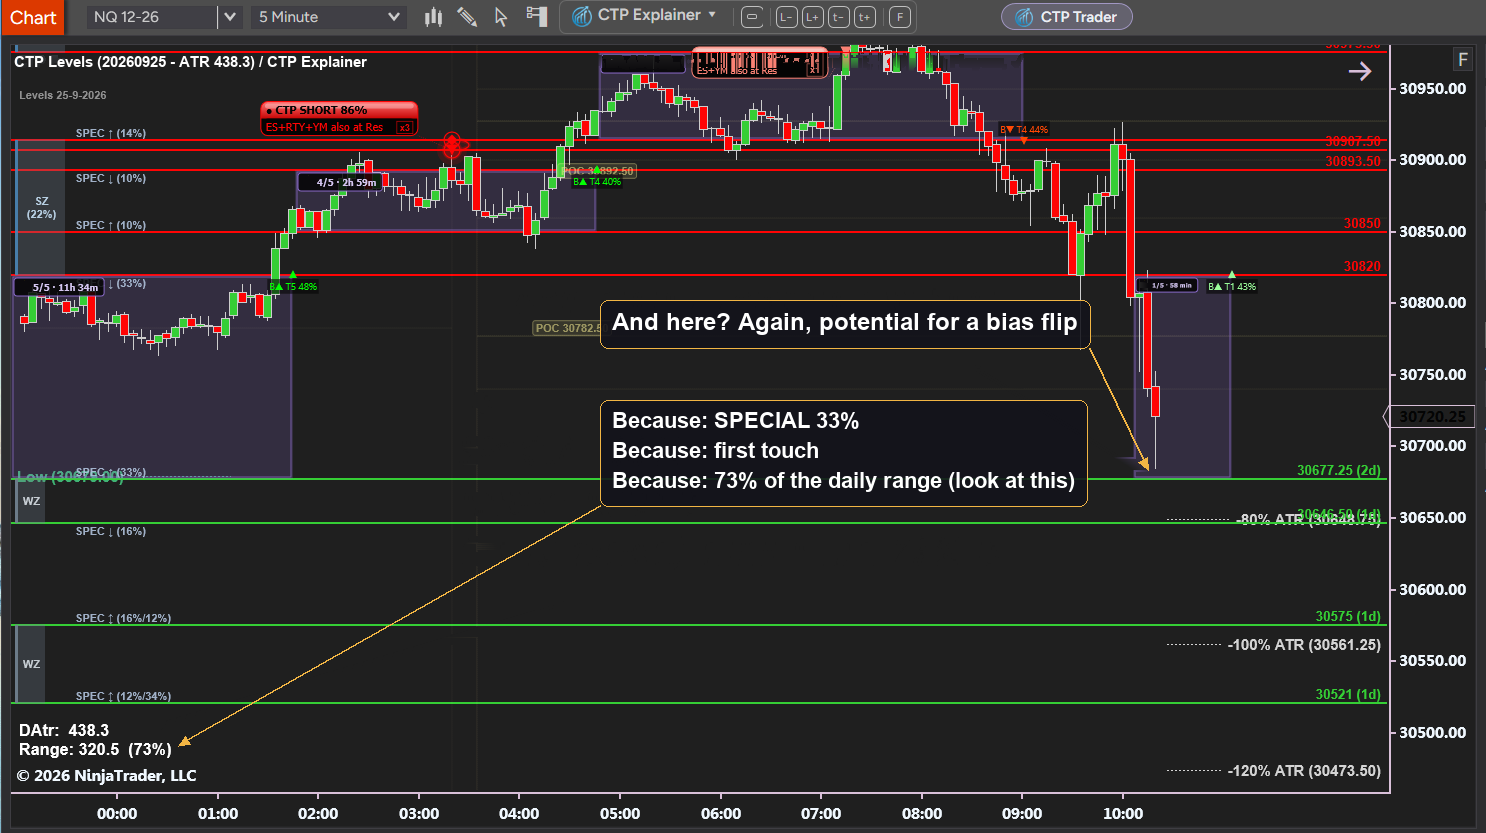
At seven in the morning the Nasdaq reached 30975. That is a special line, and at that moment three conditions came together: the market had already travelled seventy percent of its daily range, ES and YM had also touched their own lines, and this was a first touch of that line. That is what we call exhaustion. And here is the point I most want you to take from this article: exhaustion does not look like a fall. It looks like arrival at a target, with several signs happening at the same time. Whoever waits for the fall in order to understand that the energy is gone is late. And indeed, 30975 was the high of the day. This sequence, from the build-up through the breakout and the retest to the exhaustion, is what we call an episode. This episode was positive. It ended at seven in the morning.
What Happens to Whoever Didn't Notice
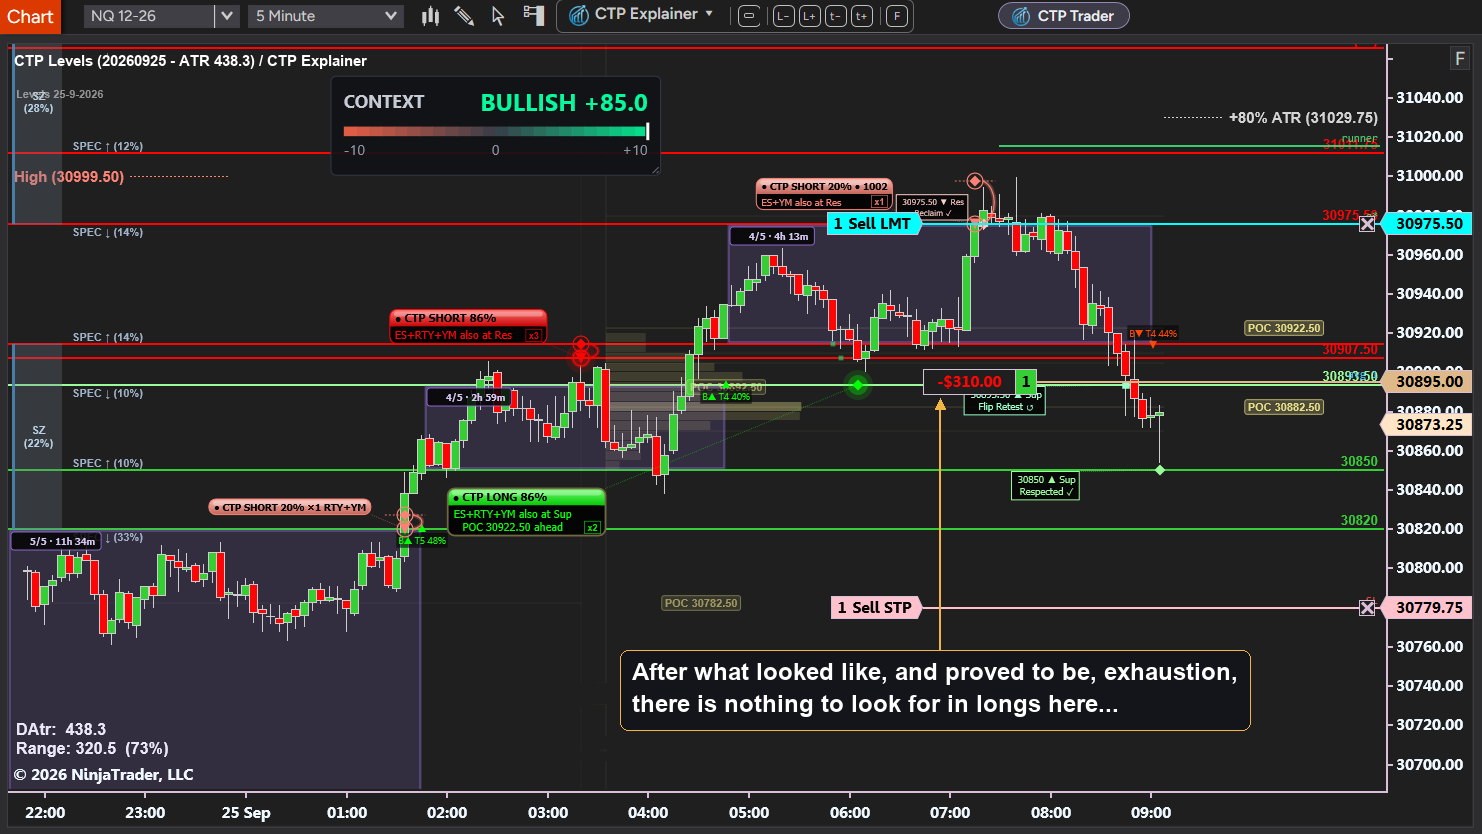
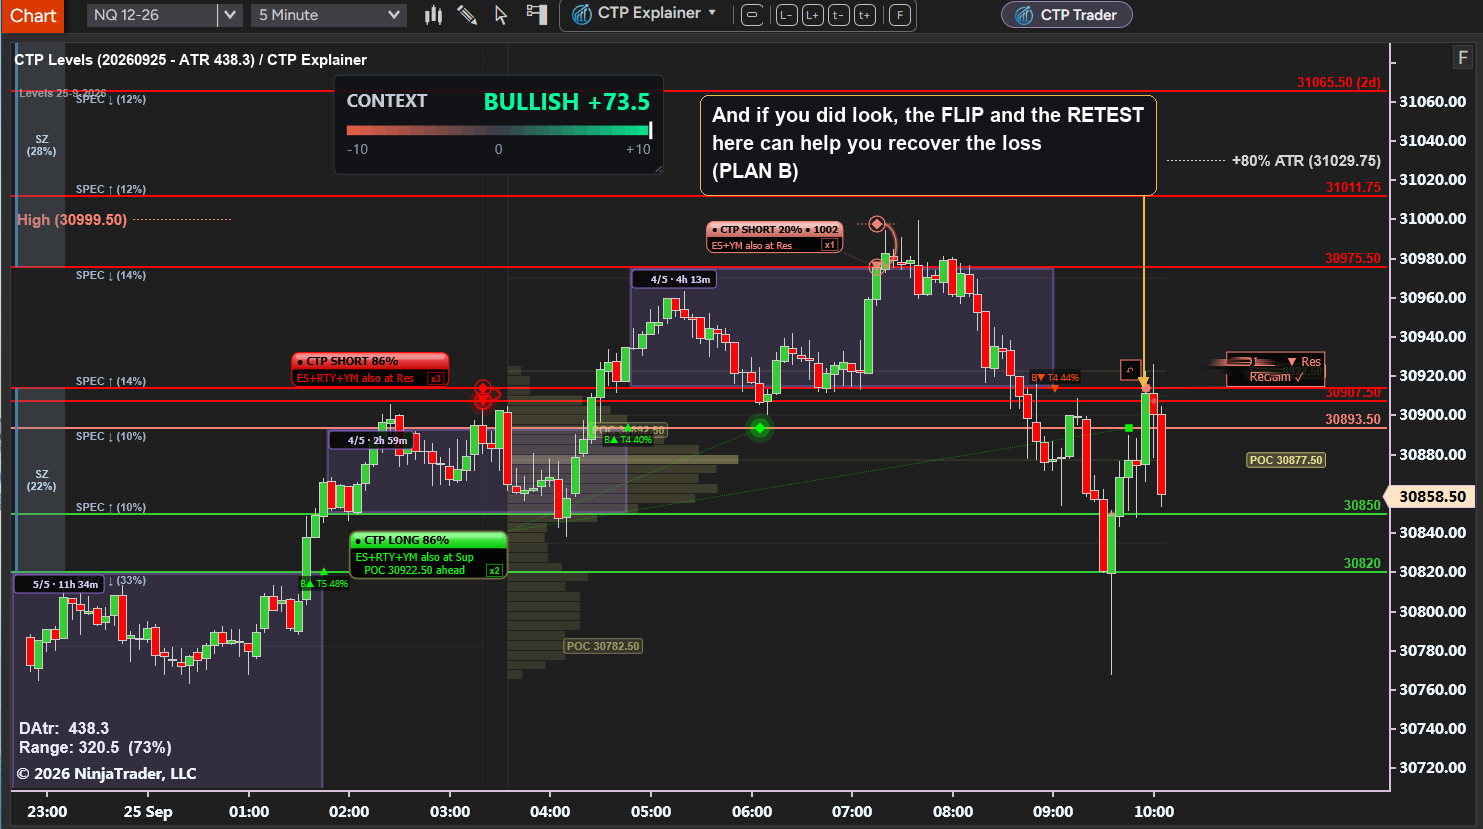
At 8:30 another long signal appeared. It looked exactly like the previous one. Whoever entered lost. Why? Because the positive episode was already over. After exhaustion we do not look for longs, even if the chart still looks green. And what do you do if you entered anyway? There is a plan B. The 30907 line, which was support, flipped into resistance. When the market came back to test it from below, at 9:45, that was the opportunity to recover the loss with a short. That is what we call a flip and retest.
The Same Story, in Reverse
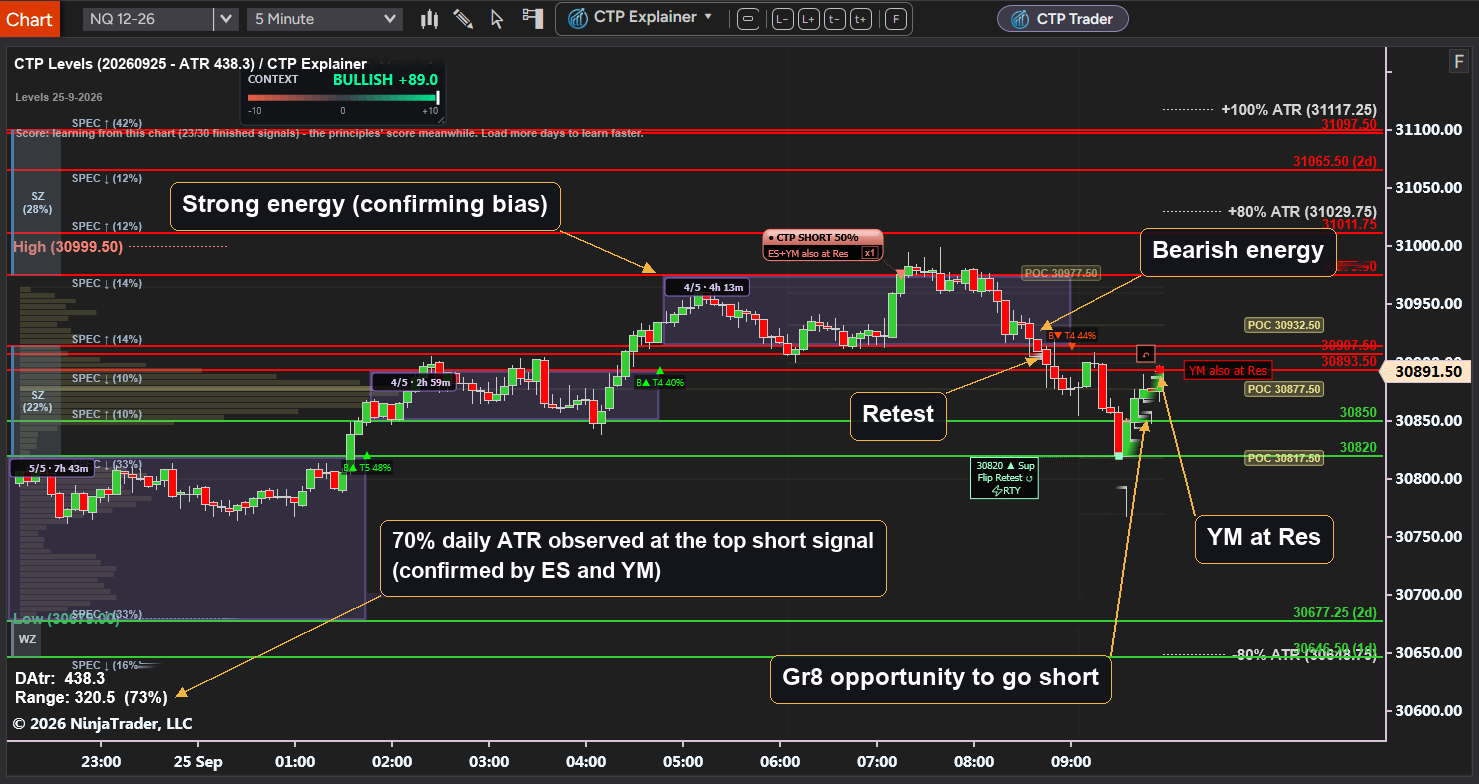
From here everything repeats itself, upside down. The drop from 30975 to 30893 is negative energy. The retest from below confirms it. YM reaches its own resistance at the same moment, and that is the confirmation from the brothers. By ten the market breaks 30820 and falls to 30677.
And there, at a quarter past ten, again three signs together: a special line, a first touch, and seventy-three percent of the daily range. Exhaustion. The negative episode ended exactly the way the positive one ended. The same signs, the same definition. At noon the Nasdaq returned to 30907. Again it reached the line together with the brothers, again without really touching it. A new story had begun.
And What About When Nothing Makes Sense
Sometimes you look at the chart and understand nothing. No direction, no feel, no signal. That happens to me too, after years. And it is not a failure. It is one of three states, and each one has a simple answer.
The first state: the market has not reached any line yet. There is nothing to understand, there is something to wait for. It is like waiting for a bus at a stop. It has not come yet, and that does not mean you got confused. The second state: the market is between two stories. The rise is over, the fall has not started, and the brothers do not agree with each other. That is the most dangerous moment of the day, because it feels as if you know. The rule is simple: when the brothers disagree, you do not enter. Whoever went long at 8:30 was not confused. He was certain, and that was the problem. The third state: the rules simply do not work today. A breakout with no retest, a retest with no continuation, a target with no pause. That happens on news days, on holidays, in thin hours. On a day like that the best position is to be out. And what all three states share: being out is a decision, not indecision. Whoever can say "I don't know" keeps his money for the next story.
What to Take Home
You do not need an algorithm to see this. You need to know what to look for:
- A market chopping between two distant lines is building energy. That is not boredom, it is preparation.
- After a breakout, wait for the retest. That is where the edge is.
- Watch the brothers. All of them arriving at their lines together is the signal. One of them arriving is noise.
- Exhaustion is arrival at a target with several signs together, not a fall. Learn to recognise it before the price turns.
- After exhaustion, do not chase the old direction. Start looking the other way.
When you look at your next chart, try to tell the story in these words: where it built energy, where it broke out, where it came back to test, where everyone arrived together, and where it exhausted. That is all. The rest is experience, and the training has already given you the foundation.